
Based on the last image in this set; I cleaned up the typography.
Based on the last image in this set; I cleaned up the typography.

You might be thinking: Booze? Drugs? Porn? Videogames?
No. It means something even more illicit…
GLUTEN. And pork chops.
Awww yisss.
(But not too much bread. I’m hittin’ the gym, you know.)
Or, to borrow a couple of panels from Kate Beaton’s comics:

Click the comic to see the source.

Found via Imgur. Click to see the source.
And geez, Luke’s doing a killer impression of Emperor Sheev Palaptine “O-face”…

Found via Imgur. Click to see the source.
There. Much better.
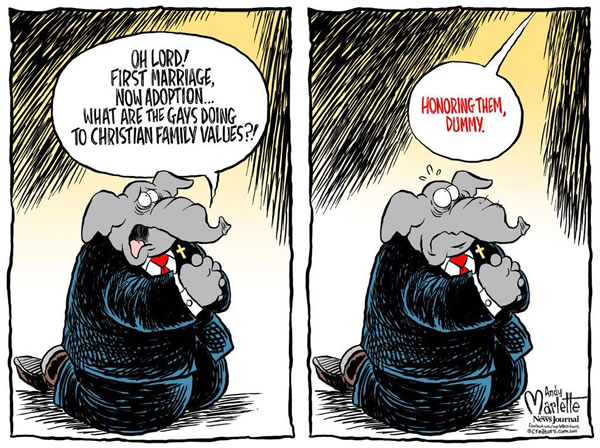
Editorial cartoon by Andy Marlette. Click to see the source.
Andy Marlette drew the editorial cartoon above in response to a proposed bill that would let privately-owned adoption agencies dodge being considered as discriminating against clients if doing so would “violate [the agencies’] written religious or moral convictions or policies,” the bill reads. Alas, the bill passed yesterday.
The worst part about the bill passing wasn’t that it passed, but this moment when Republican Committee Chair and unmitigated asshole Charles McBurney laughingly cut off 10-year-old Nathaniel Gill’s testimony at a House Judiciary Committee meeting on the issue. Nathaniel is the son of the gay man who successfully toppled Florida’s adoption ban in the courts, and the bill is seen as “revenge” for that. As committee chair, McBurney could’ve given the nervous boy a little more time to complete his testimony, but in true neo-Pharisee fashion, cut him off and snickered as he did so:
It’s as if they’re trying to prove this maxim true:
Conservatism is the dread fear that somewhere, somehow, someone you think is your inferior is being treated as your equal.

An older neighborhood scene in Sanford, Florida. Creative Commons photo by Steven Martin. Click to see the source.
 Last week, Business Insider published an article titled How much you have to earn to be considered middle class in every US state. The meat of the article was contained in the chart pictured on the right (you can click on it to see the original article and the chart at full size).
The problem with the chart is that it’s a graphic. All you can do is read it. You can’t copy-and-paste them so that you can do your own math or check Business Insider’s math; if you want to work with the numbers, you have to a fair bit of typing.
I thought I’d fix that. I opened up a new spreadsheet at typed in the states and corresponding median household incomes listed on Business Insider’s chart, and had the spreadsheet do the rest of the math. Better still, I saved the spreadsheet as a .CSV file so you can import them into your favorite number-crunching tool and have at them.
| State | Median annual household income | Median monthly household income | Middle class lower bound (two-thirds of median) | Middle class upper bound (twice median) |
|---|---|---|---|---|
| Maryland | $ 72,483 | $ 6,040 | $ 48,564 | $ 144,966 |
| Alaska | $ 72,237 | $ 6,020 | $ 48,399 | $ 144,474 |
| New Jersey | $ 70,165 | $ 5,847 | $ 47,011 | $ 140,330 |
| Hawaii | $ 68,020 | $ 5,668 | $ 45,573 | $ 136,040 |
| D.C. | $ 67,572 | $ 5,631 | $ 45,273 | $ 135,144 |
| Connecticut | $ 67,098 | $ 5,592 | $ 44,956 | $ 134,196 |
| Massachusetts | $ 66,768 | $ 5,564 | $ 44,735 | $ 133,536 |
| New Hampshire | $ 64,230 | $ 5,353 | $ 43,034 | $ 128,460 |
| Virginia | $ 62,666 | $ 5,222 | $ 41,986 | $ 125,332 |
| Minnesota | $ 60,702 | $ 5,059 | $ 40,670 | $ 121,404 |
| California | $ 60,190 | $ 5,016 | $ 40,327 | $ 120,380 |
| Utah | $ 59,770 | $ 4,981 | $ 40,046 | $ 119,540 |
| Colorado | $ 58,823 | $ 4,902 | $ 39,411 | $ 117,646 |
| Wyoming | $ 58,752 | $ 4,896 | $ 39,364 | $ 117,504 |
| Washington | $ 58,405 | $ 4,867 | $ 39,131 | $ 116,810 |
| Delaware | $ 57,846 | $ 4,821 | $ 38,757 | $ 115,692 |
| New York | $ 57,369 | $ 4,781 | $ 38,437 | $ 114,738 |
| Illinois | $ 56,210 | $ 4,684 | $ 37,661 | $ 112,420 |
| Rhode Island | $ 55,902 | $ 4,659 | $ 37,454 | $ 111,804 |
| North Dakota | $ 55,709 | $ 4,642 | $ 37,325 | $ 111,418 |
| Vermont | $ 52,578 | $ 4,382 | $ 35,227 | $ 105,156 |
| Iowa | $ 52,229 | $ 4,352 | $ 34,993 | $ 104,458 |
| Pennsylvania | $ 52,007 | $ 4,334 | $ 34,845 | $ 104,014 |
| Texas | $ 51,704 | $ 4,309 | $ 34,642 | $ 103,408 |
| Wisconsin | $ 51,467 | $ 4,289 | $ 34,483 | $ 102,934 |
| Nebraska | $ 51,440 | $ 4,287 | $ 34,465 | $ 102,880 |
| Nevada | $ 51,230 | $ 4,269 | $ 34,324 | $ 102,460 |
| Kansas | $ 50,972 | $ 4,248 | $ 34,151 | $ 101,944 |
| Oregon | $ 50,251 | $ 4,188 | $ 33,668 | $ 100,502 |
| South Dakota | $ 48,947 | $ 4,079 | $ 32,794 | $ 97,894 |
| Arizona | $ 48,510 | $ 4,043 | $ 32,502 | $ 97,020 |
| Michigan | $ 48,273 | $ 4,023 | $ 32,343 | $ 96,546 |
| Ohio | $ 48,081 | $ 4,007 | $ 32,214 | $ 96,162 |
| Georgia | $ 47,829 | $ 3,986 | $ 32,045 | $ 95,658 |
| Indiana | $ 47,529 | $ 3,961 | $ 31,844 | $ 95,058 |
| Maine | $ 46,974 | $ 3,915 | $ 31,473 | $ 93,948 |
| Montana | $ 46,972 | $ 3,914 | $ 31,471 | $ 93,944 |
| Missouri | $ 46,931 | $ 3,911 | $ 31,444 | $ 93,862 |
| Idaho | $ 46,783 | $ 3,899 | $ 31,345 | $ 93,566 |
| Florida | $ 46,036 | $ 3,836 | $ 30,844 | $ 92,072 |
| North Carolina | $ 45,906 | $ 3,826 | $ 30,757 | $ 91,812 |
| Oklahoma | $ 45,690 | $ 3,808 | $ 30,612 | $ 91,380 |
| Tennessee | $ 44,297 | $ 3,691 | $ 29,679 | $ 88,594 |
| Louisiana | $ 44,164 | $ 3,680 | $ 29,590 | $ 88,328 |
| South Carolina | $ 44,163 | $ 3,680 | $ 29,589 | $ 88,326 |
| New Mexico | $ 43,872 | $ 3,656 | $ 29,394 | $ 87,744 |
| Kentucky | $ 43,399 | $ 3,617 | $ 29,077 | $ 86,798 |
| Alabama | $ 42,849 | $ 3,571 | $ 28,709 | $ 85,698 |
| West Virginia | $ 41,253 | $ 3,438 | $ 27,640 | $ 82,506 |
| Arkansas | $ 40,511 | $ 3,376 | $ 27,142 | $ 81,022 |
| Mississippi | $ 37,963 | $ 3,164 | $ 25,435 | $ 75,926 |
![]() Want this data? Download it! [3 KB CSV file]
Want this data? Download it! [3 KB CSV file]

Cass Street Bridge and Downtown Tampa Reflected in the Hillsborough River. Creative Commons photo by Matthew Paulson. Click to see the source.
Yesterday, Business Insider published a similar article, Here’s what you have to earn to be considered middle class in the 50 biggest US cities. Once again, they included a chart, once again, that chart was in graphic format, and once again, I did a little work to make the data more usable. This time, I went straight to their source, the US Census Bureau’s 2013 American Community Survey. After figuring out their crazy user interface, I was able to extract the information I needed and turn it into the table and CSV file below.
| Metropolitan area | Total estimated households | Median estimated annual household income | Middle class lower bound (two-thirds of estimated median) | Middle class upper bound (twice estimated median) |
|---|---|---|---|---|
| New York-Newark-Jersey City, NY-NJ-PA |
7,080,691 | $ 65,786 | $ 44,077 | $ 131,572 |
| Los Angeles-Long Beach-Anaheim, CA |
4,251,495 | $ 58,869 | $ 39,442 | $ 117,738 |
| Chicago-Naperville-Elgin, IL-IN-WI |
3,450,331 | $ 60,564 | $ 40,578 | $ 121,128 |
| Dallas-Fort Worth-Arlington, TX |
2,406,092 | $ 57,398 | $ 38,457 | $ 114,796 |
| Philadelphia-Camden-Wilmington, PA-NJ-DE-MD |
2,218,312 | $ 60,482 | $ 40,523 | $ 120,964 |
| Houston-The Woodlands-Sugar Land, TX |
2,158,139 | $ 57,366 | $ 38,435 | $ 114,732 |
| Washington-Arlington-Alexandria, DC-VA-MD-WV |
2,133,062 | $ 90,149 | $ 60,400 | $ 180,298 |
| Miami-Fort Lauderdale-West Palm Beach, FL |
2,032,438 | $ 46,946 | $ 31,454 | $ 93,892 |
| Atlanta-Sandy Springs-Roswell, GA |
1,954,348 | $ 55,733 | $ 37,341 | $ 111,466 |
| Boston-Cambridge-Newton, MA-NH | 1,763,437 | $ 72,907 | $ 48,848 | $ 145,814 |
| Detroit-Warren-Dearborn, MI | 1,658,085 | $ 51,857 | $ 34,744 | $ 103,714 |
| San Francisco-Oakland-Hayward, CA |
1,654,554 | $ 79,624 | $ 53,348 | $ 159,248 |
| Phoenix-Mesa-Scottsdale, AZ | 1,553,429 | $ 51,847 | $ 34,737 | $ 103,694 |
| Seattle-Tacoma-Bellevue, WA | 1,392,337 | $ 67,479 | $ 45,211 | $ 134,958 |
| Minneapolis-St. Paul-Bloomington, MN-WI |
1,332,110 | $ 67,194 | $ 45,020 | $ 134,388 |
| Riverside-San Bernardino-Ontario, CA |
1,297,675 | $ 53,220 | $ 35,657 | $ 106,440 |
| Tampa-St. Petersburg-Clearwater, FL |
1,139,923 | $ 45,880 | $ 30,740 | $ 91,760 |
| St. Louis, MO-IL | 1,105,652 | $ 54,449 | $ 36,481 | $ 108,898 |
| San Diego-Carlsbad, CA | 1,093,386 | $ 61,426 | $ 41,155 | $ 122,852 |
| Baltimore-Columbia-Towson, MD | 1,037,921 | $ 68,455 | $ 45,865 | $ 136,910 |
| Denver-Aurora-Lakewood, CO | 1,035,096 | $ 62,760 | $ 42,049 | $ 125,520 |
| Pittsburgh, PA | 988,106 | $ 51,291 | $ 34,365 | $ 102,582 |
| Portland-Vancouver-Hillsboro, OR-WA |
881,822 | $ 59,168 | $ 39,643 | $ 118,336 |
| Charlotte-Concord-Gastonia, NC-SC |
859,709 | $ 51,251 | $ 34,338 | $ 102,502 |
| Cleveland-Elyria, OH | 844,428 | $ 49,358 | $ 33,070 | $ 98,716 |
| Cincinnati, OH-KY-IN | 822,005 | $ 53,378 | $ 35,763 | $ 106,756 |
| Kansas City, MO-KS | 798,618 | $ 56,248 | $ 37,686 | $ 112,496 |
| Sacramento–Roseville–Arden-Arcade, CA |
792,639 | $ 57,027 | $ 38,208 | $ 114,054 |
| Orlando-Kissimmee-Sanford, FL | 780,174 | $ 46,962 | $ 31,465 | $ 93,924 |
| San Antonio-New Braunfels, TX | 778,939 | $ 51,716 | $ 34,650 | $ 103,432 |
| Columbus, OH | 750,394 | $ 54,079 | $ 36,233 | $ 108,158 |
| Indianapolis-Carmel-Anderson, IN |
739,503 | $ 51,087 | $ 34,228 | $ 102,174 |
| Las Vegas-Henderson-Paradise, NV |
713,577 | $ 51,057 | $ 34,208 | $ 102,114 |
| Austin-Round Rock, TX | 688,938 | $ 61,750 | $ 41,373 | $ 123,500 |
| Nashville-Davidson–Murfreesboro–Franklin, TN |
662,187 | $ 51,996 | $ 34,837 | $ 103,992 |
| San Jose-Sunnyvale-Santa Clara, CA |
636,628 | $ 91,533 | $ 61,327 | $ 183,066 |
| Virginia Beach-Norfolk-Newport News, VA-NC |
625,540 | $ 56,161 | $ 37,628 | $ 112,322 |
| Milwaukee-Waukesha-West Allis, WI |
622,962 | $ 51,957 | $ 34,811 | $ 103,914 |
| Providence-Warwick, RI-MA | 618,975 | $ 55,055 | $ 36,887 | $ 110,110 |
| Jacksonville, FL | 516,144 | $ 51,495 | $ 34,502 | $ 102,990 |
| Louisville/Jefferson County, KY-IN | 494,276 | $ 50,905 | $ 34,106 | $ 101,810 |
| Oklahoma City, OK | 493,315 | $ 50,136 | $ 33,591 | $ 100,272 |
| Memphis, TN-MS-AR | 492,311 | $ 46,962 | $ 31,465 | $ 93,924 |
| New Orleans-Metairie, LA | 479,366 | $ 45,981 | $ 30,807 | $ 91,962 |
| Buffalo-Cheektowaga-Niagara Falls, NY |
469,897 | $ 50,548 | $ 33,867 | $ 101,096 |
| Richmond, VA | 467,399 | $ 57,286 | $ 38,382 | $ 114,572 |
| Hartford-West Hartford-East Hartford, CT | 464,315 | $ 66,356 | $ 44,459 | $ 132,712 |
| Raleigh, NC | 449,589 | $ 61,710 | $ 41,346 | $ 123,420 |
| Birmingham-Hoover, AL | 431,462 | $ 48,328 | $ 32,380 | $ 96,656 |
| Rochester, NY | 425,603 | $ 51,857 | $ 34,744 | $ 103,714 |
| Tucson, AZ | 391,975 | $ 43,824 | $ 29,362 | $ 87,648 |
![]() Want this data? Download it! [5 KB CSV file]
Want this data? Download it! [5 KB CSV file]

